Summary
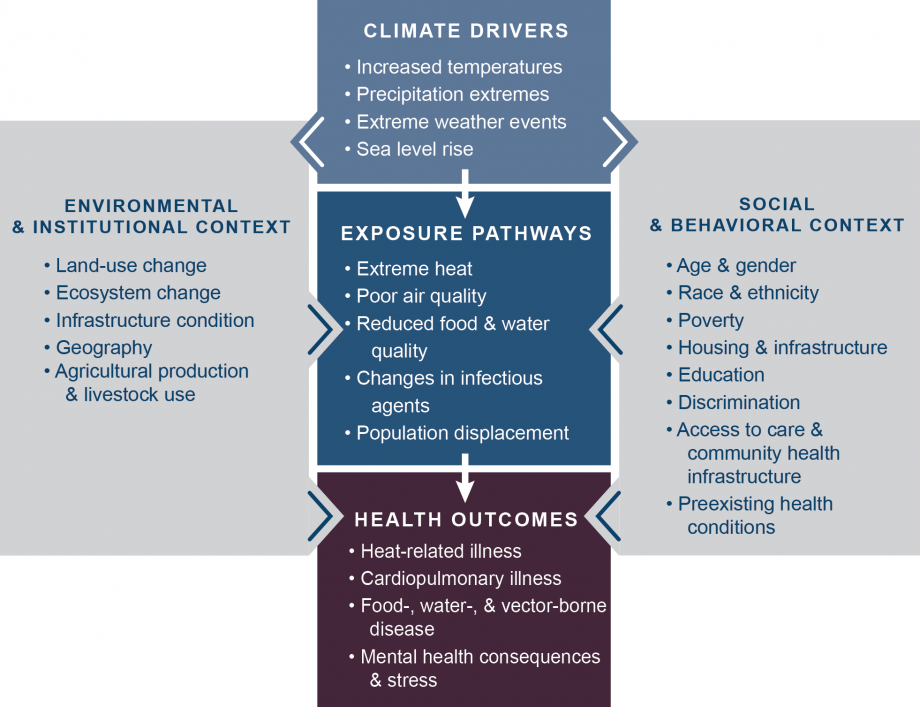
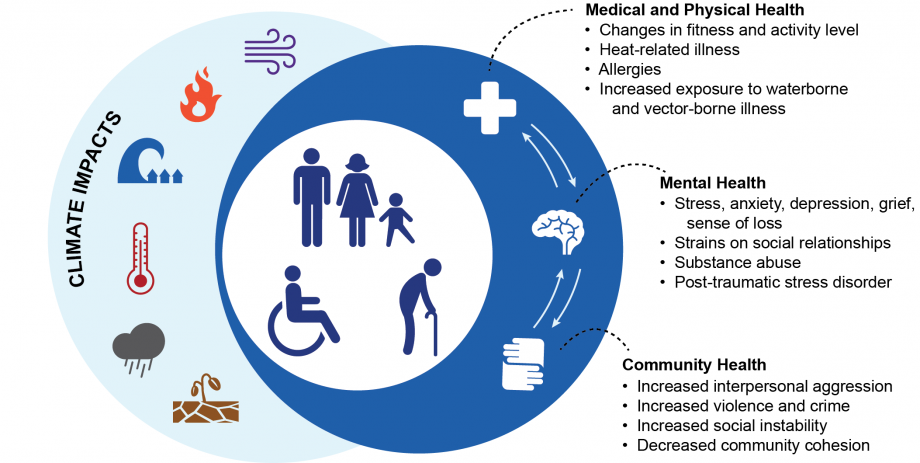
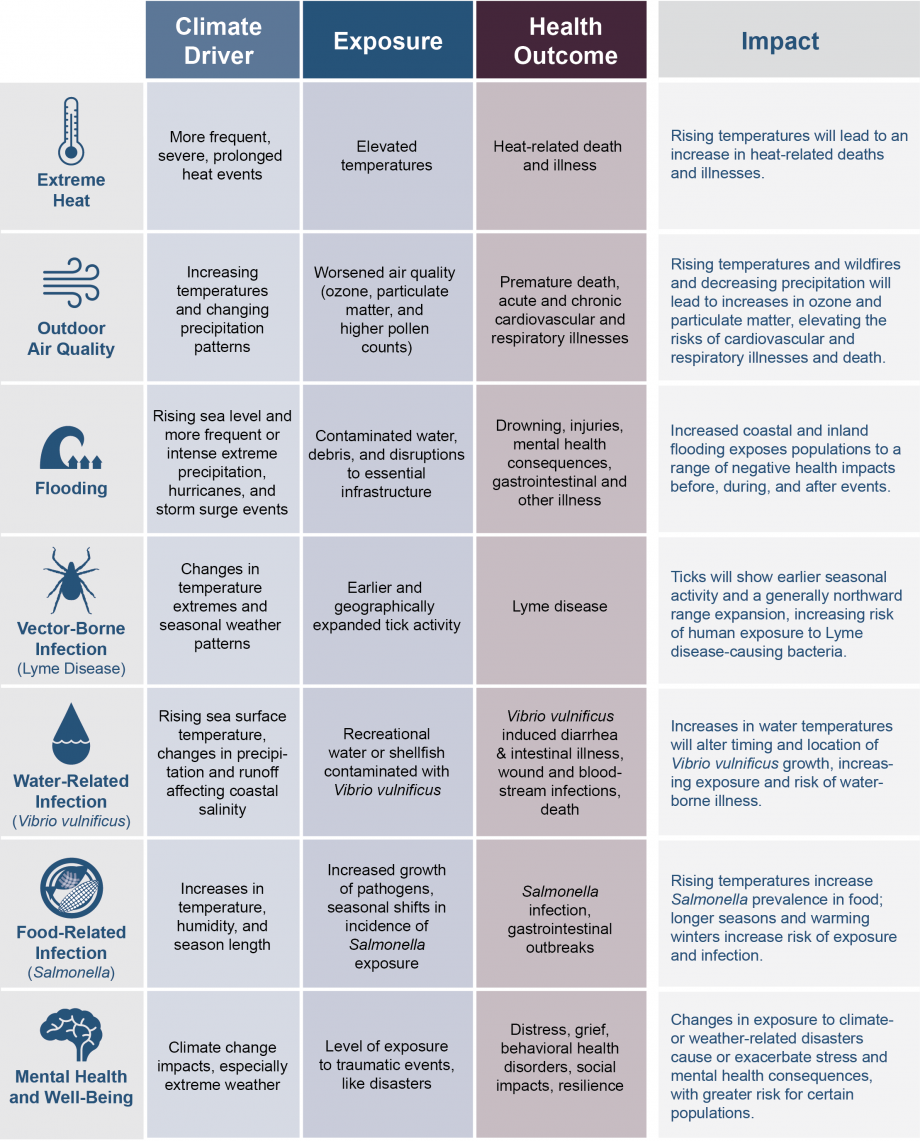
Figure ES1: Examples of Climate Impacts on Human Health
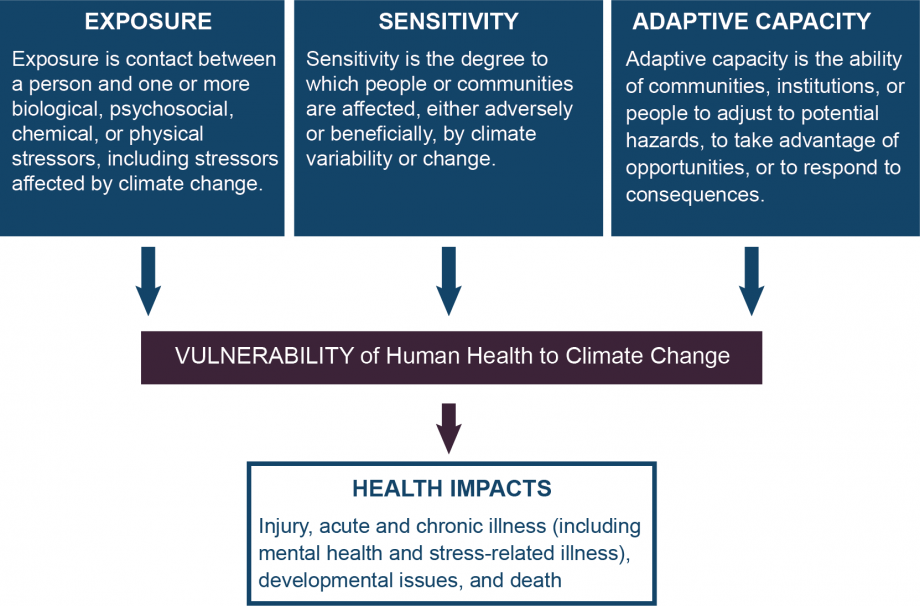
Climate change is a significant threat to the health of the American people. The impacts of human-induced climate change are increasing nationwide. Rising greenhouse gas concentrations result in increases in temperature, changes in precipitation, increases in the frequency and intensity of some extreme weather events, and rising sea levels. These climate change impacts endanger our health by affecting our food and water sources, the air we breathe, the weather we experience, and our interactions with the built and natural environments. As the climate continues to change, the risks to human health continue to grow.
Current and future climate impacts expose more people in more places to public health threats. Already in the United States, we have observed climate-related increases in our exposure to elevated temperatures; more frequent, severe, or longer-lasting
Every American is vulnerable to the health impacts associated with climate change. Increased exposure to multiple health threats, together with changes in
In recent years, scientific understanding of how climate change increases risks to human health has advanced significantly. Even so, the ability to evaluate, monitor, and project health effects varies across climate impacts. For instance, information on health outcomes differ in terms of whether complete, long-term datasets exist that allow quantification of observed changes, and whether existing models can project impacts at the timescales and geographic scales of interest. Differences also exist in the metrics available for observing or projecting different health impacts. For some health impacts, the available metrics only describe changes in risk of exposure, while for others, metrics describe changes in actual health outcomes (such as the number of new cases of a disease or an increase in deaths).
This assessment strengthens and expands our understanding of climate-related health impacts by providing a more definitive description of climate-related health burdens in the United States. It builds on the 2014 National Climate Assessment5 and reviews and synthesizes key contributions to the published literature. Acknowledging the rising demand for data that can be used to characterize how climate change affects health, this report assesses recent analyses that quantify observed and projected health impacts. Each chapter characterizes the strength of the scientific evidence for a given climate–health exposure pathway or “link” in the causal chain between a climate change impact and its associated health outcome. This assessment’s findings represent an improvement in scientific confidence in the link between climate change and a broad range of threats to public health, while recognizing